---
jupyter:
jupytext:
notebook_metadata_filter: all
text_representation:
extension: .md
format_name: markdown
format_version: '1.1'
jupytext_version: 1.1.7
kernelspec:
display_name: Python 3
language: python
name: python3
language_info:
codemirror_mode:
name: ipython
version: 3
file_extension: .py
mimetype: text/x-python
name: python
nbconvert_exporter: python
pygments_lexer: ipython3
version: 3.6.5
plotly:
description: Introduction to the new Plotly FigureWidget
display_as: chart_events
language: python
layout: base
name: Plotly FigureWidget Overview
order: 0
page_type: example_index
permalink: python/figurewidget/
thumbnail: thumbnail/figurewidget-overview.gif
---
#### Create a Simple FigureWidget
Create an empty FigureWidget and then view it.
```python
import plotly.graph_objects as go
f = go.FigureWidget()
f
```
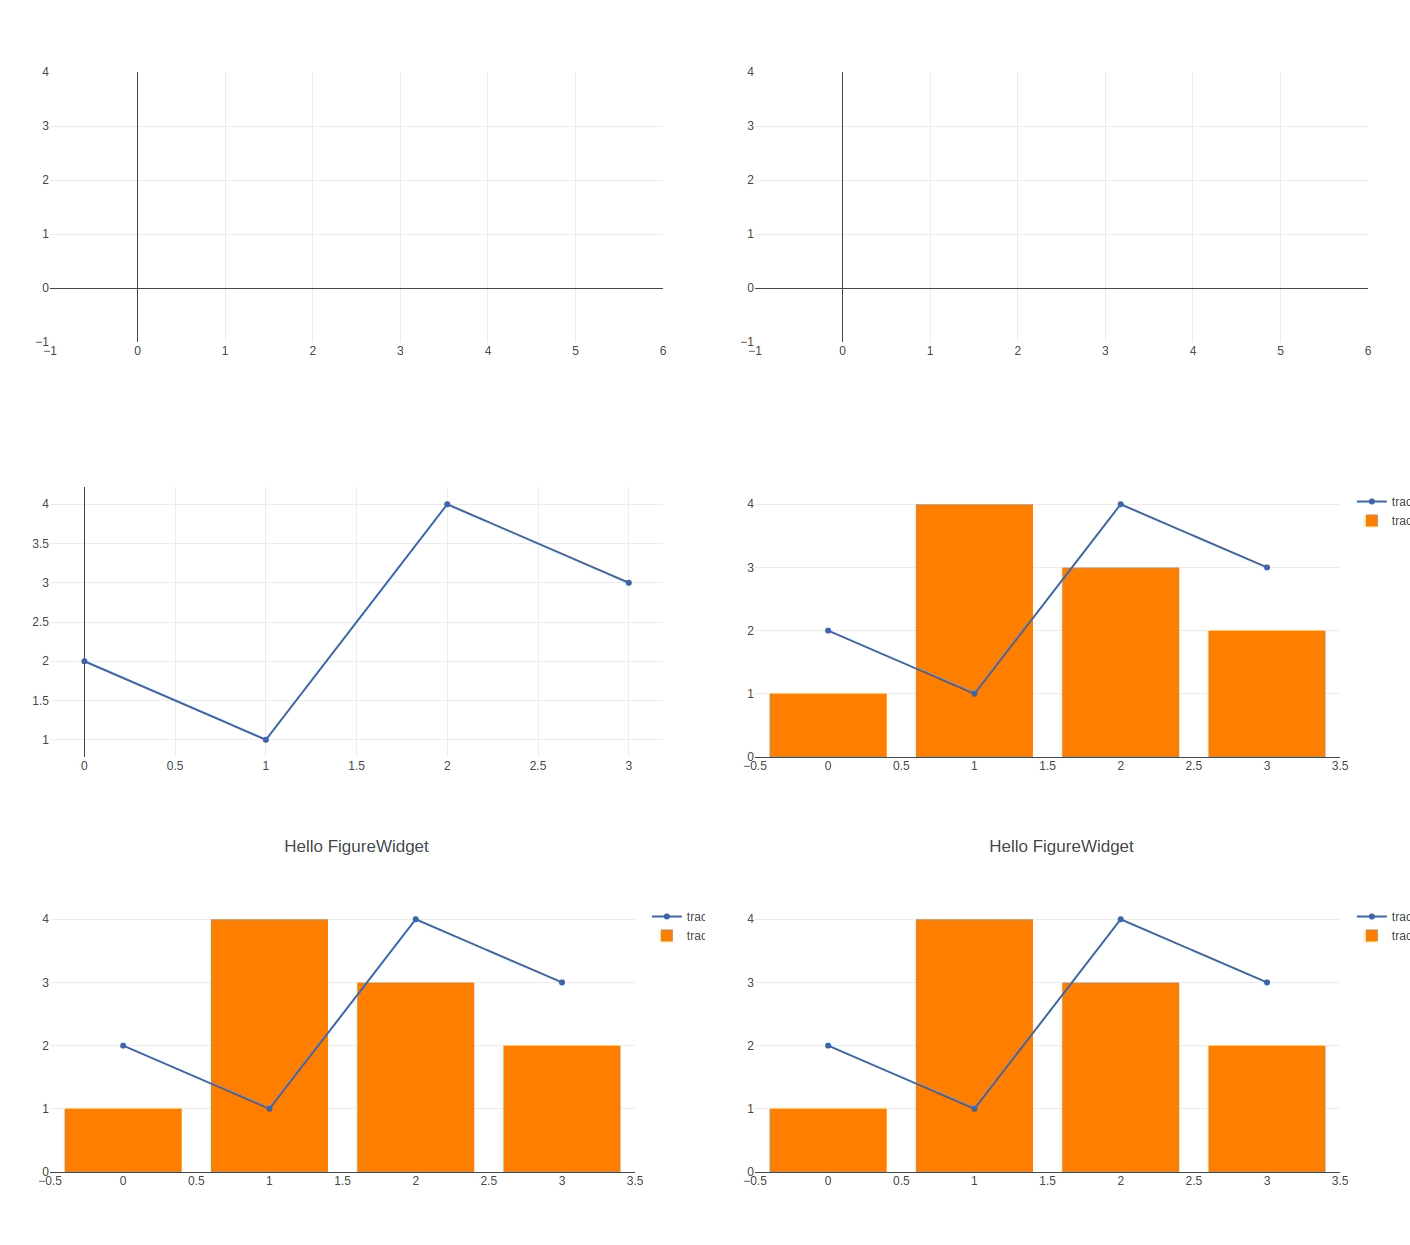
 Add traces or update the layout and then watch the output above update in real time.
```python
f.add_scatter(y=[2, 1, 4, 3]);
```
```python
f.add_bar(y=[1, 4, 3, 2]);
```
```python
f.layout.title = 'Hello FigureWidget'
```
Add traces or update the layout and then watch the output above update in real time.
```python
f.add_scatter(y=[2, 1, 4, 3]);
```
```python
f.add_bar(y=[1, 4, 3, 2]);
```
```python
f.layout.title = 'Hello FigureWidget'
```
 #### Update the Data and the Layout
```python
# update scatter data
scatter = f.data[0]
scatter.y = [3, 1, 4, 3]
```
```python
# update bar data
bar = f.data[1]
bar.y = [5, 3, 2, 8]
```
```python
f.layout.title.text = 'This is a new title'
```
#### Construct a FigureWidget from a Figure graph object
A standard `Figure` object can be passed to the `FigureWidget` constructor.
```python
import plotly.graph_objects as go
trace = go.Heatmap(z=[[1, 20, 30, 50, 1], [20, 1, 60, 80, 30], [30, 60, 1, -10, 20]],
x=['Monday', 'Tuesday', 'Wednesday', 'Thursday', 'Friday'],
y=['Morning', 'Afternoon', 'Evening'])
data=[trace]
layout = go.Layout(title='Activity Heatmap')
figure = go.Figure(data=data, layout=layout)
f2 = go.FigureWidget(figure)
f2
```
#### Reference
See [these Jupyter notebooks](https://github.com/jonmmease/plotly_ipywidget_notebooks) for even more FigureWidget examples.
```python
help(go.FigureWidget)
```
#### Update the Data and the Layout
```python
# update scatter data
scatter = f.data[0]
scatter.y = [3, 1, 4, 3]
```
```python
# update bar data
bar = f.data[1]
bar.y = [5, 3, 2, 8]
```
```python
f.layout.title.text = 'This is a new title'
```
#### Construct a FigureWidget from a Figure graph object
A standard `Figure` object can be passed to the `FigureWidget` constructor.
```python
import plotly.graph_objects as go
trace = go.Heatmap(z=[[1, 20, 30, 50, 1], [20, 1, 60, 80, 30], [30, 60, 1, -10, 20]],
x=['Monday', 'Tuesday', 'Wednesday', 'Thursday', 'Friday'],
y=['Morning', 'Afternoon', 'Evening'])
data=[trace]
layout = go.Layout(title='Activity Heatmap')
figure = go.Figure(data=data, layout=layout)
f2 = go.FigureWidget(figure)
f2
```
#### Reference
See [these Jupyter notebooks](https://github.com/jonmmease/plotly_ipywidget_notebooks) for even more FigureWidget examples.
```python
help(go.FigureWidget)
```